Template:Wanda POS Product sales charts
From iDempiere en
Product sales charts
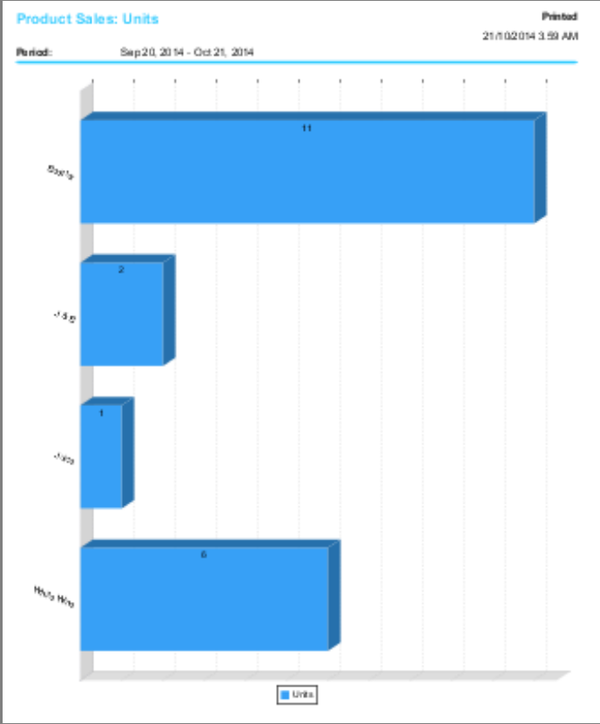
This gives a graphical representation of how much of each product that satisfied a specified constraint (or set of constraints) was sold over a specified period of time.
- Click on
 in the Administration panel on the left part of your window.
 - In the Charts section of the window displayed click on
 .
. - Use the clock to set the boundaries of the period under consideration and the form below it to set the appropriate constraints.
- Once the boundaries and constraints are set click on
 .
.
Example, Product sales charts
Let’s say we want to know how much of each drink was sold for $500 or greater from 1:00 PM of Saturday, September 20, 2014 to this very moment.
- Click on
 in the Administration panel on the left part of your window.
 - In the Charts section of the window displayed click on
 .
. - Click on the calendar beside the text field labeled Start Date, and then use the clock to set the (Check above for details on how to use the clock) date to September 20, 2014 and time to 1:00 PM.
- Click on the calendar to the right of the text field labeled End Date, click on
 and then click on
  .
. - In the section just below the clock [the section labeled ‘By Form’]. Click on the drop down menu labeled Category and select Drinks from the drop down list. Select Distinct from the drop down list labeled Name.
- Select Greater or equal from the drop down list labeled Sell Price. Click on the text field below it and type in the amount 500.
- Click on
 to display the appropriate chart.

