Template:Wanda POS Product time series charts
From iDempiere en
Product time series charts
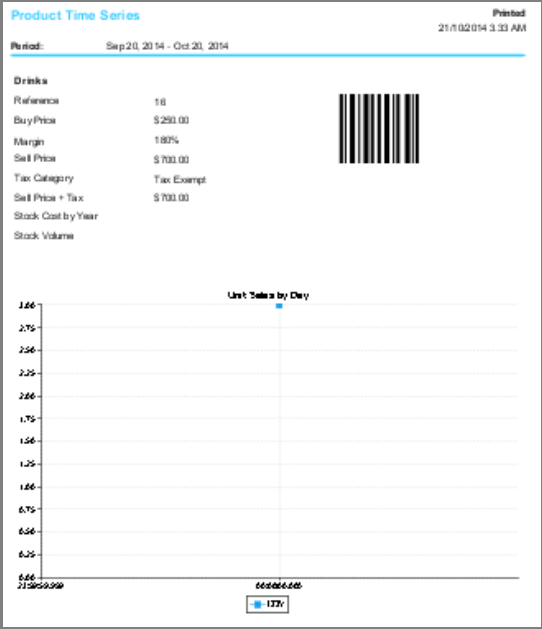
This gives information about the sales of products which satisfy a specified constraint over a specified period of time.
- Click on
 in the Administration panel on the left part of your window.
 - In the Charts section of the window displayed click on
 .
. - Use the clock to set the boundaries of the period under consideration and the form below it to set the appropriate constraints.
- Once the boundaries are set click on
 .
.
Example, Product time series charts
Let’s say we want information about drinks that were sold for $500 or greater from 1:00 PM of Saturday, September 20, 2014 to this very moment.
- Click on
 in the Administration panel on the left part of your window.
 - In the Charts section of the window displayed click on
 .
. - Click on the calendar beside the text field labeled Start Date, and then use the clock to set the date to September 20, 2014 and time to 1:00 PM. (Check above for details on how to use the clock.)
- Click on the calendar to the right of the text field labeled End Date, click on
 and then click on
  .
. - In the section just below the clock [the section labeled ‘By Form’]. Click on the drop down menu labeled Category and select Drinks from the drop down list. Select Distinct from the drop down list labeled Name.
- Select Greater or equal from the drop down list labeled Sell Price. Click on the text field below it and type in the amount 500.
- Click on
 to display the appropriate chart.

